EPM - Financials & External data in one Dashboard

- We deliver Enterprise Performance Management reporting by combining muliple data sources into Dashboards. I.e. Convenient access to all relevant enterprise data from one screen.
- Easy-to-use report pick-list provides quick access to several slices of the Enterprise. Save as Home Page and Add to Internet favorites.
- BI content blocks feature a hover tip, a drill-down analysis & option to inspect source data.
- The data cells in the OneStream Cube View include a multi-dimensional drill-down analysis & option to navigate down to source data.
Cube View Reports - Expand / Collapse Analysis
External Data Reports - Summary / Detail SQL Analysis
External Data Reports - Summary / Detail SQL Analysis
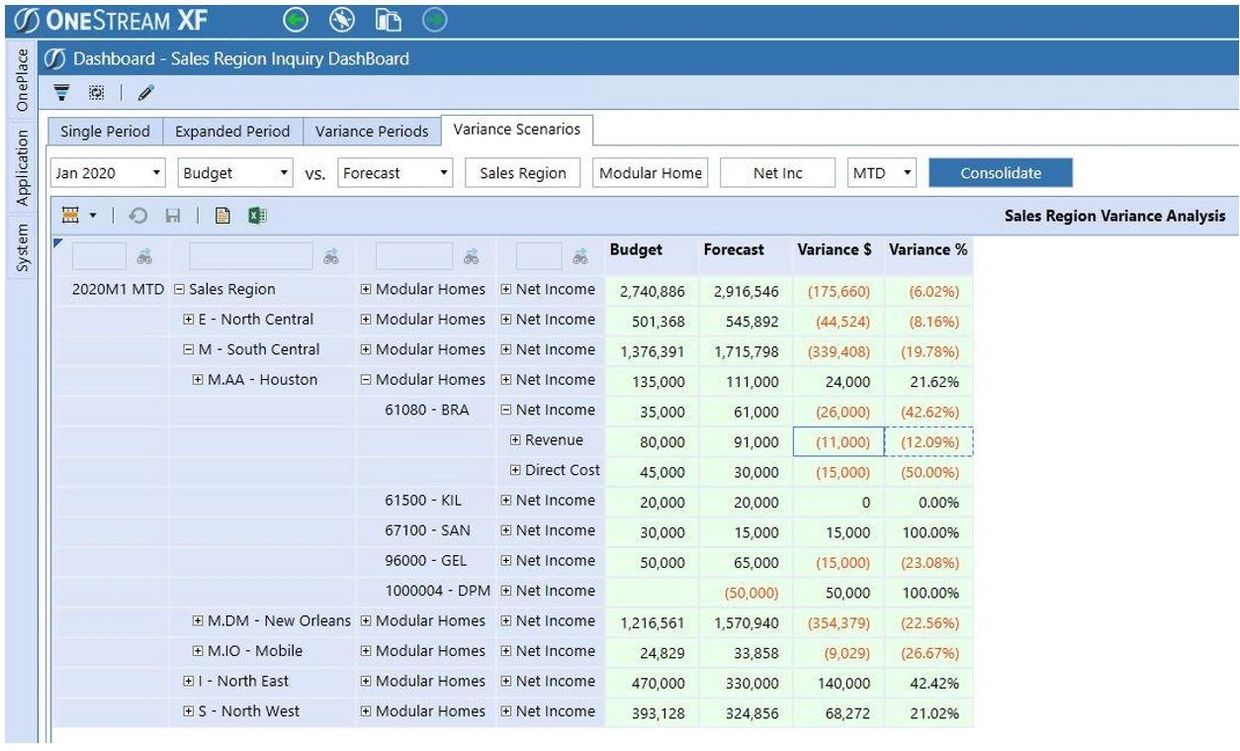
- Easy-to-use drop-down data filters change the default view. I.e, Budget vs. Forecast or Actual vs. Budget
- OneStream Consultants also use Cube Views in Report Books & OneStream Designer BI Report packages.
External Data Reports - Summary / Detail SQL Analysis
External Data Reports - Summary / Detail SQL Analysis
External Data Reports - Summary / Detail SQL Analysis
- OneStream Consultants connect to external SQL data in OneStream Dashboard Reports & Data Grids.
- A few Interactive OneStream Dashboards can satisfy the reporting requirements for many users.
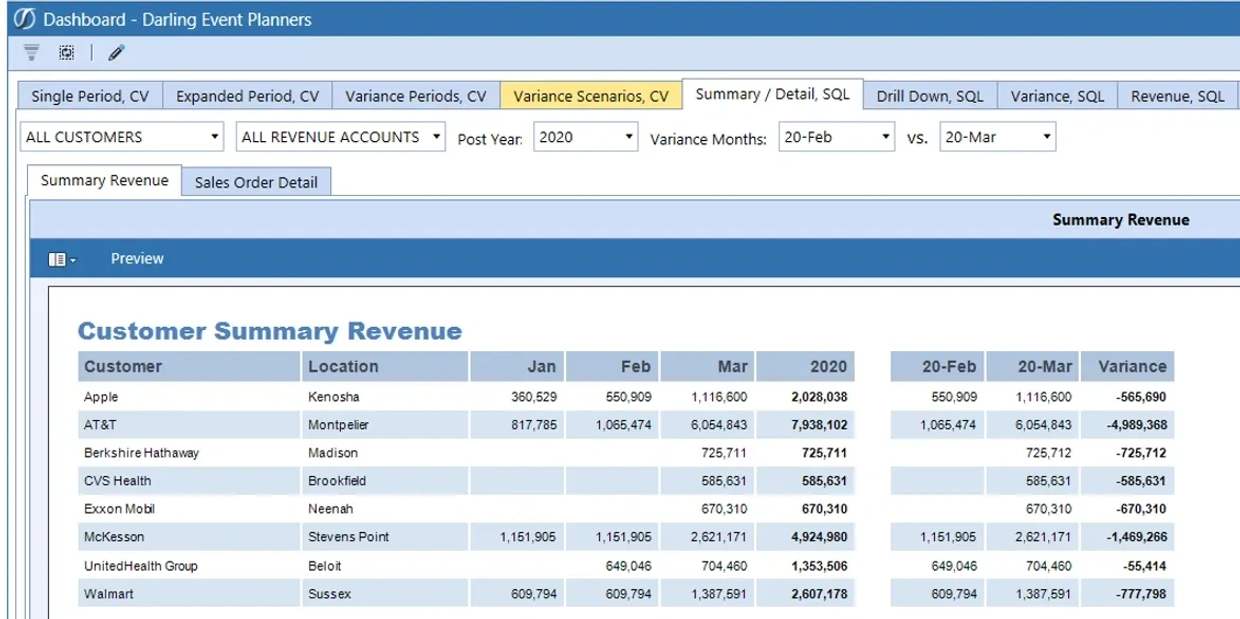
Customer Summary Analysis & Sales Order Detail Reports

- The Summary Revenue report displays one row for the selected customer. The default selection is All Customers.
- The drop-down data filter values are shared with the Order Detail Report (See below: AT&T, All Revenue Accounts, 2020)

- The 2020 Order Detail report subtotal, $7,938,102, ties back to 2020 on the Customer Summary report.
- The Order Detail report contains several additional colmns that provides insight into AT&T's 2020 spend by customer event.
Cube View Analysis & SQL Transaction Detail Data Grid

- The Cube View provides month-end balances for analysis. The current focus is Entity #400, Beginning Retained Earnings.
- The Data Grid lists the month-end transactions that are summarized in the Cube View.
- As illustrated, the Data Grid is filtered on Entity #400, Beginning Retained Earnings.
✨New✨ 9.x Web - Interactive OneStream Dashboard Data Grids


Illustrated above, users can customize OneStream dashboard Data Grids.
- The default view was a simple list of rows.We changed the layout to group by Entity and Project. (This was accomplished by dragging the Entity and Project column headers to the blank row under the tool bar.)